
FAQs
In terms of Transport – does this only incorporate car use? Or also public transport?
There are several categories of transport emissions according to the GPC protocol, and car use and public transport both overlap several of these. The categories that car use intersect with are:
On road transport (which incorporates all vehicles that travel on public-use roads, including taxis, buses, and freight, in addition to on-road electric vehicles)
Off road transport
The categories that public transport intersect are:
Rail (diesel and electric)
On road transport (buses and taxis)
Water travel (ferries)
Air travel (commercial carriers)
Of these, public transport is incorporated in the following ways:

2. How do we deal with inventory changes as methodologies and data completeness and quality improve?
Dealing with inventory changes is vital for creating a persistent program for carbon emissions mitigation. Understanding how profiles might change will provide guidance in how to develop data administration processes that will address these issues.
There are several reasons for why an inventory might change:
Bug fixes
There are many steps and calculations involved in the determination of emissions, and it is possible for errors to take place at any of these points. Bug fixes may occur at any time.
New data sets for existing sources
There are generally lots of ways in which emissions can be calculated, often involving different activity data sets. If new data sets become available this may provide ways to determine more accurate or comprehensive reporting.
Inclusion of new sources
The reporting entity may wish to expand the number of areas that reporting is done, such as including agriculture or industrial processes
Adapting to be compatible with new standards or common practices
It may be that a council has been reporting data in a certain manner but wants to adapt/change the methods or data sources used to be compatible with a standard or with a regional group.
Any of these changes will affect outputs and emissions totals. To futureproof strategies, it should be assumed that all of these possible changes will occur. The way to build a robust strategy with this is mind is actually easier than may initially be apparent.
The approach we recommend is the following:
Recognize that municipal emissions inventories should be used as a guide for policy and strategy setting, not as an absolute figure
Recognize that any strategy needs to target zero emissions on some time frame, regardless of current emission levels
Recognize that there is no currently established suite of solutions for transitioning an average municipality to zero emissions, so strategies will need to be adaptive
Use science-derived targets/budgets to ground the discussion and strategy development, but to incorporate the political/social realities of your specific municipality in setting expectations
Ensure that communications about emissions make it clear that there may be modifications or updates to the inventories over time
In regards to reporting the inventories themselves, we consider the following approach to be best for clear communication.
The specific data and methods for determining are recorded for each inventory
When a new inventory is prepared, if there has been a change to a method or data source, reporting can be done for the previous and current time periods for both old and new methods. This allows for readers to understand the implications of the update, while seeing the continuity with previous reporting. The graph below gives and example as to how this might be done.

3. When providing breakdowns of waste and transport data by residential/commercial, how do we explain the accuracy of breakdowns of data when modeled data is allocated to residential/commercial?
As with most categories of allocation, the way that allocations are done are through a ‘best match’ basis. Waste data is broken down into municipal, commercial and industrial (C&I), and construction and demolition (C&D). The majority of waste produced in the municipal stream is from the residential sector, but there is not a perfect match as some of the waste coming from this stream may originate from some commercial activity.
On-road transport emissions are calculated from fuel sales data. This data is scaled to municipalities by vehicle registration numbers. The determination of residential transport emissions is done through the registration of vehicle type, which is allocated by the following categories:
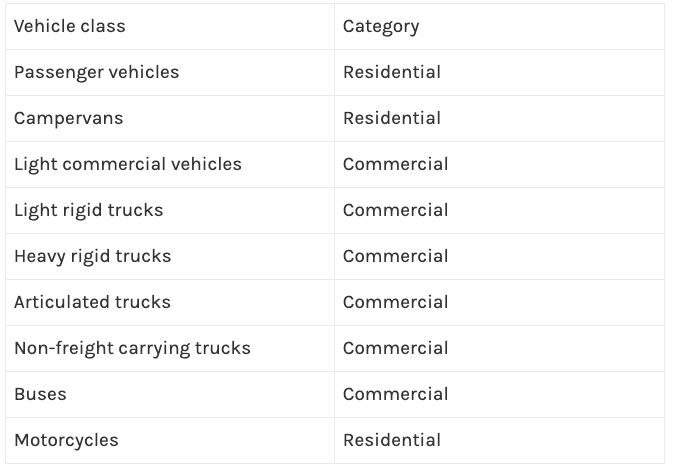
As can be seen, these classifications are somewhat arbitrary, and are made on the basis of allocating vehicle classes to the category that best represents the average use.
Special note: Transboundary emissions
Transboundary emissions are emissions associated with out-of-boundary portions of trips that partially occur within the municipality. The current methods used (fuel sales) do not look at transboundary trips. This is not a gap in total emissions calculations – all fuel consumed in Australia for vehicle traffic is accounted for – it is just not allocated to this emissions category.
4. Why are Australian council emissions per capita higher than C40 average?
This is due to a range of factors, each of which are worth investigating:
We have unusually high emissions factors for grid-supplied electricity, particularly in Victoria. This is largely due to the use of brown coal, the low efficiency of our existing coal-fired generation assets, the lack of nuclear generation assets, and a demand based that has conventionally been built on base-load demand profiles (favoring coal generation)
We have unusually high transmission and distribution losses, due largely to the longer distances that electricity needs to travel and fewer uses of HVDC infrastructure
We have high per-capita transportation emissions, which is due to both travelling further and, as compared to many C40 cities, having lower fuel efficiency standards
We have typically larger houses
A very high use of private vehicles for travel
Our building standards, specifically around energy efficiency and thermal performance, are generally poorer than most developed countries. This is particularly notable for commercial properties
Our agricultural processes, particularly in relation to beef, are typically higher emissions than other comparable countries
There are additional factors as well. Many of these factors are extensions of the very high standard of living in Australia, the mild weather conditions, the legacy of cheap electricity on system design and practices, and the country’s relatively low population density.
5. How does my council compare to other Australian councils? And how do we explain the difference?
Understanding how your council compares to other Australian councils is an outcome of the C40 project for the Greater Melbourne area, however increasingly other councils across Australia will have the capacity to compare their emissions to their peers and regions as GPC compliant inventories become standard practice.
6. Can we include data on renewable energy generation in the municipality?
We already determine emissions on distributed solar PV generation within your municipality using the activity tool. Emissions from solar hot water (SHW), microwind, microhydro, and fuel cells and other technologies may be incorporated through identification of the individual systems (SHW and microwind are recorded through the renewable energy credits registry with the Australian federal government). If aggregate generation data is not available then an appropriate deeming method will need to be determined. It should be noted that these systems should not generally be incorporated into GPC profiles as they do not generate emissions, and therefore are effectively invisible. If there is an emissions source (such as fuel cells using methane derived from fossil fuels) then this can be included, but materiality should be considered.
Commercial generation systems (e.g. solar farms, wind farms) are already incorporated into the national greenhouse account factors for electricity generation, and so should not be added for the purposes of GPC profiles.
7. What is the difference between data year value and inventory year value?
Data year is the year that a particular data set is sourced from. Inventory year is the year that the inventory is being developed for. For instance, if you are preparing an inventory for 2017, the inventory year is 2017. If it is using a data set from 2015, the data year for that data is 2015.
8. Does the waste modelling take into account methane flaring?
There are two methods for taking into account methane flaring for waste. The first is through using the default scaling factors. These have an assumed methane flaring conversion ratio, which is calculated at the state level. This is determined through calculating the ratio of state-level reported emissions divided by the emissions that should have occurred based on the state-level reported activity data. This ratio is assumed to be the effect of flaring or other on-site treatments of the waste. The assumed values for each state (for 2017) are as follows:

The second method involves providing specific information about any methane flaring that takes place within landfill facilities where waste from the municipality are deposited. Currently the activity tool only allows for one common total for methane flaring data, but this can be aggregated across multiple sites if necessary.
9. Why does my inventory differ from the figures provided by other consultancies or experts?
This should be expected, for a large range of factors. Listed are some of the primary reasons:
Variations in the scope of activities/sources included
Variations between data sources used, including errors in data, gaps or double counting in data
Use of data from different time periods
Use of differing methods for converting activity data into emissions
Use of differing factors (such as global warming potential coefficients, or fugitive gas factors)
Use of differing scaling methods, including variation in parameters used for scaling, or variations in the models used for scaling (for instance, using linear or quadratic scaling regressions)
Human error
The profiles developed through the C40 project has certain strengths and weaknesses in the calculated inventories, and information about which inventories/methods to use should be done with information about the benefits of each approach. The C40 inventories prioritize the following:
Applying consistent methods to all municipalities, which prioritizes data that is available across all councils
Using modelling methods to scale using relevant municipal characteristics, allowing for inventories to be projected into the future and past
Emphasizing methods that ensure that activity data across all municipalities add up to the total for Victoria, for the purpose of avoiding gaps or double counting
Overall the emphasis is on allowing for apples-to-apples comparisons between councils in the Greater Melbourne area and to all other councils using the GPC framework.
10. Why are modeled emissions from industrial energy use so different compared to detailed data/previous inventory?
This is because of improved understanding of the factors that drive industrial emissions. This category has always been the most challenging to understand because it varies much more significantly that either residential or commercial activity. Additionally, previous data sources that were used (such as aggregate data from Victoria dating from 2013 and earlier) has been identified as having a high level of uncertainty, which has driven concerns about its applicability for representing emissions. Data from other states have had similar issues identified.
There are ongoing concerns in the way that activity data for industrial activity is reported, because there are still gaps and variations in reporting practices by distributors. The Ironbark team continues to work with distributors and state governments to consistently improve practice in this area and are happy to talk to any stakeholders interested in progressing this discussion.
11. Does GPC include in its methodology the sequestration part of the calculation?
There are two key ways in which persistent sequestration occurs within municipalities at commercial scales.
Through the growth of forests/vegetation
Through carbon capture and storage (CCS) processes
Ironbark has developed methods for recording sequestration through the first method, which is based on the change of land use from cropland/grassland to forest. This is incorporated into the AFOLU category of emissions, however, and is not included in a BASIC profile.
CCS is not currently included in activity tool calculations are there are no commercially operating CCS plants in Victoria.
In general, the GPC protocol can incorporate any sequestration through a ‘net impact’ process. If CCS is connected to a powerplant, for instance, the emissions of that plant will be adjusted to show the net emissions. In a situation such as we have in Australia, this will then be reflected in the calculated national greenhouse accounts factors used for determining the emissions density of grid-supplied electricity.
If it is a standalone project within a municipal boundary that is unconnected to a particular emissions source (for instance, if it was removing carbon dioxide from the air), this may be included as an ‘Other Scope 3’ emissions source with a negative value.
12. How are solid waste emissions allocated to scope 1 or 3?
Solid waste emissions are Scope 1 if the final disposal (e.g. landfill) of the waste occurs within the municipal boundary. If it occurs outside of the municipal boundary, it is Scope 3.
13. How do we incorporate the methane correction factor in inventory?
If this question refers to the global warming potential (GWP) factor for methane, this is incorporated through basic emission coefficients derived from the IPCC. The activity tool currently uses the 4AR dataset published by the IPCC, however this can be updated if needed.
14. Does GPC include in its methodology the sequestration part of the calculation?
There are two key ways in which persistent sequestration occurs within municipalities at commercial scales.
Through the growth of forests/vegetation
Through carbon capture and storage (CCS) processes
Ironbark has developed methods for recording sequestration through the first method, which is based on the change of land use from cropland/grassland to forest. This is incorporated into the AFOLU category of emissions, however, and is not included in a BASIC profile.
CCS is not currently included in activity tool calculations are there are no commercially operating CCS plants in Victoria.
In general, the GPC protocol can incorporate any sequestration through a ‘net impact’ process. If CCS is connected to a powerplant, for instance, the emissions of that plant will be adjusted to show the net emissions. In a situation such as we have in Australia, this will then be reflected in the calculated national greenhouse accounts factors used for determining the emissions density of grid-supplied electricity.
If it is a standalone project within a municipal boundary that is unconnected to a particular emissions source (for instance, if it was removing carbon dioxide from the air), this may be included as an ‘Other Scope 3’ emissions source with a negative value.
15. Why don’t we use DNSP (distributor data) for all energy emissions?
In general it is because it is not available, however there are additional factors. The main additional factor is that there is little supporting information about the method of allocation for DNSP data to municipal boundaries, to sectors, and if there are any gaps or exclusions.
Ironbark is currently pursuing conversations with distributors to provide documentation and methods for these considerations. The intention is to move over to real-time data provision from distributors, however there is additional work needed to establish how this will occur.